Building a Linear Regression Tree with Multiple Features: A Detailed Implementation Guide
Overview
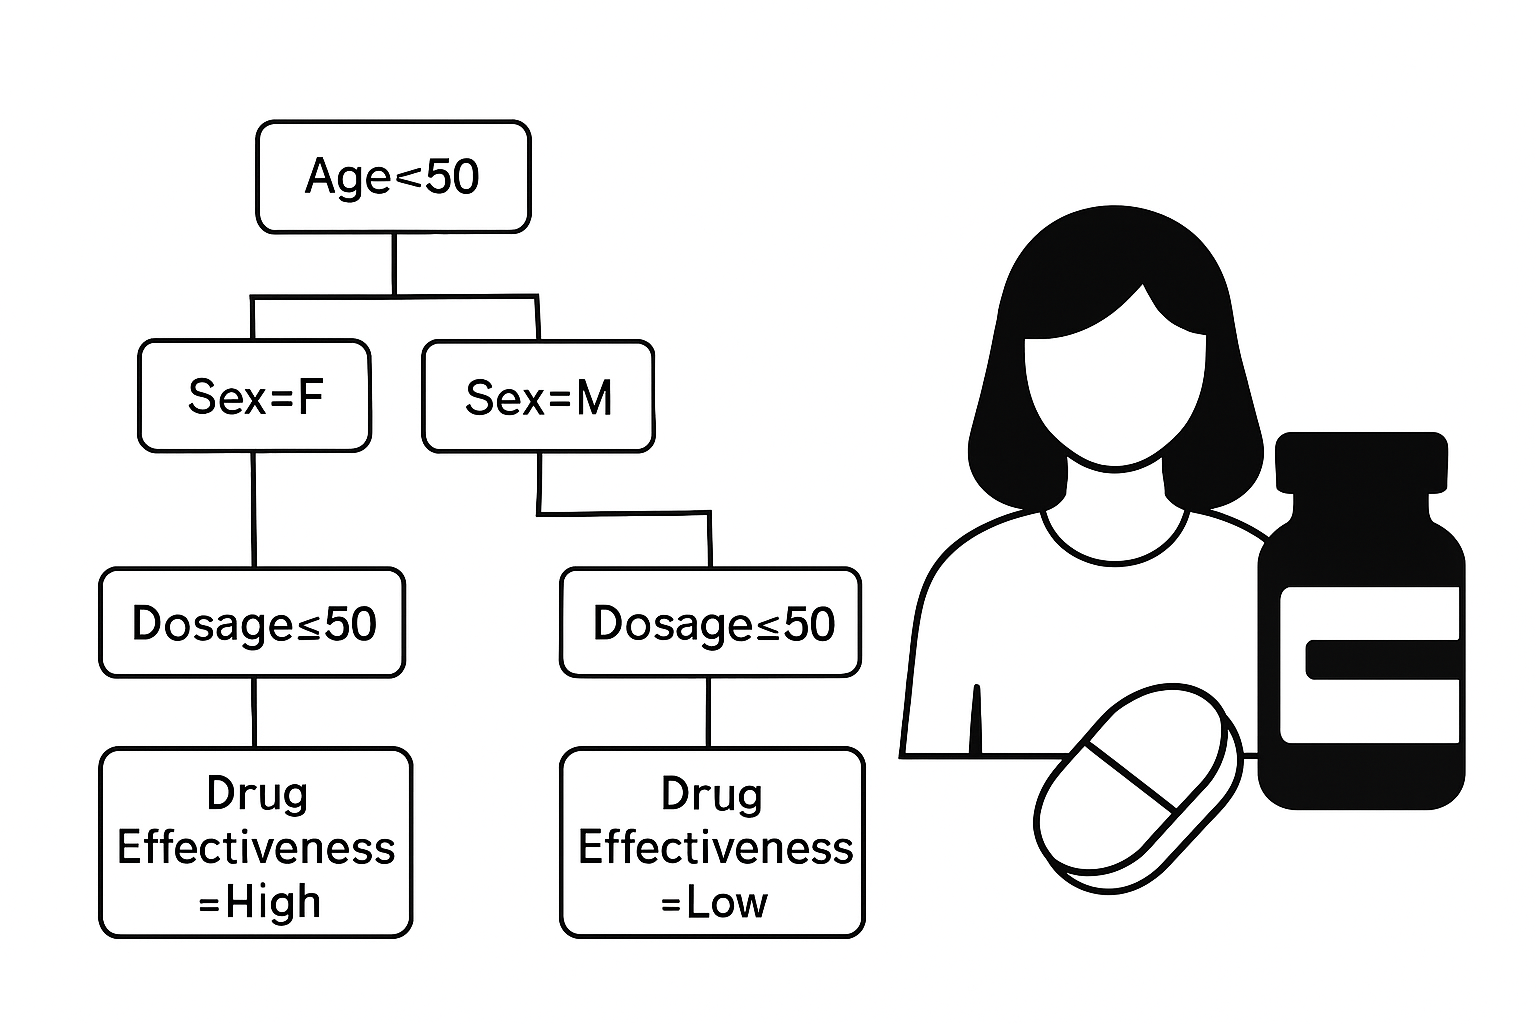
A linear regression tree is a supervised learning model that combines decision tree structure with linear regression models at the leaves. Instead of predicting a constant value at each terminal node, the model learns a linear equation using multiple features. This approach improves accuracy for problems where relationships vary across regions of the feature space.
This article provides a detailed breakdown of implementing such a model from scratch, highlighting key design decisions, trade-offs between different techniques, and practical considerations for real-world applications.
Core Concept
A traditional regression tree partitions the feature space into regions and predicts the mean target value in each region. A linear regression tree replaces these constant predictions with locally fitted linear models.
Each leaf node contains a model of the form:
[
y = \beta_0 + \beta_1 x_1 + \beta_2 x_2 + \dots + \beta_p x_p
]
This allows the model to capture both nonlinear global structure (through the tree splits) and linear local behavior (through the leaf regressions). The result is a piecewise linear model that adapts to different regions of the feature space.
Data Requirements
To build a regression tree with multiple features, the dataset should include:
- A continuous target variable
- Multiple numerical or encoded categorical features
- A sufficient number of samples to support local model fitting (typically 10-20 samples per feature per leaf)
- Limited multicollinearity for stable coefficient estimation
Feature scaling is critical when using regularized regression in the leaves. Without scaling, features with larger ranges dominate the regularization penalty, leading to biased coefficient estimates.
Model Construction Process
1. Tree Structure and Node Representation
The fundamental building block is a tree node that can either be an internal node (with a split) or a leaf node (with a linear model). Here’s a minimal node structure:
class Node:
    def __init__(self, depth: int = 0):
        self.depth = depth
        self.feature_idx: Optional[int] = None  # Feature used for splitting
        self.threshold: Optional[float] = None  # Split threshold
        self.left: Optional['Node'] = None
        self.right: Optional['Node'] = None
        self.model = None  # Linear regression model at leaf
        self.scaler = None  # Feature scaler for regularization
        self.is_leaf = False
        self.sample_indices: Optional[np.ndarray] = None
Trade-off: Using a class-based structure provides clarity and maintainability at the cost of slightly more memory overhead compared to array-based representations. For production systems with millions of nodes, array-based structures may be preferred for memory efficiency.
2. Tree Splitting Criterion
The key difference from standard regression trees is how we evaluate splits. Instead of minimizing variance alone, we evaluate splits based on the reduction in linear model error.
RSS Reduction Method
The most accurate approach fits linear models to both sides of a candidate split and computes the total residual sum of squares (RSS):
def compute_split_score(X, y, feature_idx, threshold):
    # Split data
    left_mask = X[:, feature_idx] <= threshold
    right_mask = ~left_mask

    # Fit models to both sides
    model_left = fit_linear_model(X[left_mask], y[left_mask])
    model_right = fit_linear_model(X[right_mask], y[right_mask])

    # Compute total RSS
    rss_left = np.sum((y[left_mask] - model_left.predict(X[left_mask])) ** 2)
    rss_right = np.sum((y[right_mask] - model_right.predict(X[right_mask])) ** 2)

    return -(rss_left + rss_right)  # Negative because we maximize
Trade-off: This method is computationally expensive (O(n × p²) per split) but directly optimizes prediction error. It’s the most accurate approach for linear relationships.
Variance Reduction Method
A faster alternative uses variance reduction, similar to standard regression trees:
def compute_variance_reduction(X, y, feature_idx, threshold):
    left_mask = X[:, feature_idx] <= threshold
    right_mask = ~left_mask

    parent_var = np.var(y)
    left_var = np.var(y[left_mask])
    right_var = np.var(y[right_mask])

    n_left, n_right, n_total = len(y[left_mask]), len(y[right_mask]), len(y)

    # Weighted variance reduction
    variance_reduction = parent_var - (
        (n_left / n_total) * left_var + (n_right / n_total) * right_var
    )

    return variance_reduction
Trade-off: This is O(n) complexity vs O(n × p²) for RSS reduction—approximately 100× faster. However, it assumes constant predictions (like standard trees), so it’s less accurate for linear relationships. Use when speed is critical and linear relationships are weak.
Finding the Best Split
To balance speed and accuracy, we use percentile-based threshold selection rather than testing every unique value:
def find_best_split(X, y, sample_indices):
    best_score = -np.inf
    best_feature = None
    best_threshold = None

    for feature_idx in range(n_features):
        feature_values = np.unique(X[sample_indices, feature_idx])

        # Use percentiles to reduce candidate thresholds
        # Trade-off: Testing fewer thresholds is faster but may miss optimal split
        percentiles = np.arange(10, 100, 5)  # ~16 candidates per feature
        candidate_thresholds = np.percentile(feature_values, percentiles)

        for threshold in candidate_thresholds:
            score = compute_split_score(X, y, feature_idx, threshold)
            if score > best_score:
                best_score = score
                best_feature = feature_idx
                best_threshold = threshold

    return best_feature, best_threshold
Trade-off: Testing all unique values (O(n) candidates) is most accurate but slow. Percentile-based selection (O(k) candidates, typically k=16-20) provides a good balance, reducing computation by 10-50× with minimal accuracy loss.
3. Leaf Level Regression with Multiple Features
Each leaf fits a multivariate linear model. The choice of regression method significantly impacts both performance and stability.
Ordinary Least Squares (OLS)
The simplest approach uses standard linear regression:
from sklearn.linear_model import LinearRegression

model = LinearRegression()
model.fit(X_scaled, y)
Trade-off: Fastest method with no hyperparameters, but unstable with many features or multicollinearity. Use when n_samples >> n_features and features are well-conditioned.
Ridge Regression
Ridge regression adds L2 regularization to shrink coefficients:
from sklearn.linear_model import Ridge
from sklearn.preprocessing import StandardScaler

scaler = StandardScaler()
X_scaled = scaler.fit_transform(X)  # Critical: must scale for regularization

model = Ridge(alpha=1.0)  # alpha controls regularization strength
model.fit(X_scaled, y)
Trade-off: Best general-purpose choice—stable, handles multicollinearity, but all features are retained (no sparsity). Use when all features are potentially relevant and multicollinearity is present. Always scale features before applying Ridge—without scaling, features with larger ranges dominate the penalty.
Lasso Regression
Lasso adds L1 regularization, which can zero out coefficients:
from sklearn.linear_model import Lasso

scaler = StandardScaler()
X_scaled = scaler.fit_transform(X)

model = Lasso(alpha=0.1)  # Lower alpha typically needed than Ridge
model.fit(X_scaled, y)
Trade-off: Automatic feature selection and sparse solutions, but can be unstable with highly correlated features. Use when many irrelevant features exist and interpretability is important. Note that Lasso may arbitrarily select one feature from a group of correlated features.
Elastic Net
Elastic Net combines L1 and L2 penalties:
from sklearn.linear_model import ElasticNet

model = ElasticNet(alpha=1.0, l1_ratio=0.5)  # l1_ratio: 0=Ridge, 1=Lasso
model.fit(X_scaled, y)
Trade-off: Best of both worlds—handles correlated features (like Ridge) while enabling feature selection (like Lasso). However, it requires tuning two hyperparameters (alpha and l1_ratio), making it more complex. Use when you have a mix of relevant/irrelevant features and correlated features.
Regularization Strength Selection
The choice of alpha (regularization strength) is critical:
- Too small: Overfitting, unstable coefficients
- Too large: Underfitting, all coefficients near zero
- Optimal: Balance between bias and variance
Use cross-validation to select alpha:
from sklearn.model_selection import GridSearchCV

param_grid = {'alpha': [0.01, 0.1, 1.0, 10.0, 100.0]}
grid_search = GridSearchCV(Ridge(), param_grid, cv=5, scoring='neg_mean_squared_error')
grid_search.fit(X_scaled, y)
best_alpha = grid_search.best_params_['alpha']
Trade-off: Cross-validation is computationally expensive but provides better generalization. For large datasets, use a validation set instead of full CV.
4. Tree Building Algorithm
The tree is built recursively, with stopping criteria to prevent overfitting:
def build_tree(X, y, sample_indices, depth=0):
    node = Node(depth=depth)
    node.sample_indices = sample_indices

    # Stopping conditions
    if (depth >= max_depth or
        len(sample_indices) < min_samples_split or
        len(np.unique(y[sample_indices])) == 1):  # Pure node

        # Create leaf with linear model
        model, scaler = create_leaf_model(X[sample_indices], y[sample_indices])
        node.model = model
        node.scaler = scaler
        node.is_leaf = True
        return node

    # Find best split
    best_feature, best_threshold = find_best_split(X, y, sample_indices)

    if best_feature is None:
        # No valid split found, make leaf
        model, scaler = create_leaf_model(X[sample_indices], y[sample_indices])
        node.model = model
        node.scaler = scaler
        node.is_leaf = True
        return node

    # Create split and recurse
    node.feature_idx = best_feature
    node.threshold = best_threshold

    left_mask = X[sample_indices, best_feature] <= best_threshold
    left_indices = sample_indices[left_mask]
    right_indices = sample_indices[~left_mask]

    node.left = build_tree(X, y, left_indices, depth + 1)
    node.right = build_tree(X, y, right_indices, depth + 1)

    return node
Stopping Criteria Trade-offs:
- max_depth: Simple but may stop too early (underfitting) or too late (overfitting). Start with depth=5-10 and tune based on validation performance.
- min_samples_split: Prevents overfitting but increases bias. Typical values: 20-50 samples.
- min_samples_leaf: Ensures sufficient data for stable regression. Critical for linear models—use at least 10-20 samples per feature. For 5 features, use min_samples_leaf ≥ 10.
- Combined approach: More robust but requires tuning multiple hyperparameters.
5. Prediction
Prediction involves traversing the tree to a leaf, then applying the leaf’s linear model:
def predict_single(x):
    node = root

    # Traverse to leaf
    while not node.is_leaf:
        if x[node.feature_idx] <= node.threshold:
            node = node.left
        else:
            node = node.right

    # Apply leaf model
    if node.scaler is not None:
        x_scaled = node.scaler.transform(x.reshape(1, -1))
    else:
        x_scaled = x.reshape(1, -1)

    return node.model.predict(x_scaled)[0]
Trade-off: Prediction is O(depth) for tree traversal plus O(p) for linear prediction, making it very fast. This is one of the key advantages over global linear models.
Advanced Techniques
Pruning Strategies
Pruning prevents overfitting by removing branches that don’t improve validation performance. The most common approach is cost-complexity pruning:
def prune_node(node, X_val, y_val, alpha):
    """
    Cost-complexity pruning: Error + alpha * (number of leaves)

    Trade-off: Higher alpha = simpler tree (more pruning),
               lower alpha = more complex (less pruning)
    """
    if node.is_leaf:
        return node

    # Prune children first
    node.left = prune_node(node.left, X_val, y_val, alpha)
    node.right = prune_node(node.right, X_val, y_val, alpha)

    # Compute cost if we keep the split
    split_error = compute_node_error(node, X_val, y_val)
    n_leaves = count_leaves(node)
    split_cost = split_error + alpha * n_leaves

    # Compute cost if we make this a leaf
    leaf_error = compute_leaf_error(node, X_val, y_val)
    leaf_cost = leaf_error + alpha * 1  # One leaf

    # Prune if leaf is better
    if leaf_cost <= split_cost:
        node.is_leaf = True
        node.model = fit_leaf_model(X_val[node.sample_indices], y_val[node.sample_indices])
        node.left = None
        node.right = None

    return node
Trade-off: Pruning reduces overfitting but requires a separate validation set. Alternative: Use early stopping (max_depth, min_samples_leaf) which is simpler but less adaptive. Use cross-validation to find optimal alpha.
Bayesian Linear Regression in Leaves
For uncertainty quantification, we can use Bayesian linear regression:
def fit_bayesian_leaf_model(X, y, prior_precision=1.0):
    """
    Bayesian linear regression with conjugate priors.

    Assumes: y ~ N(X*beta, sigma^2), beta ~ N(0, (alpha*I)^-1)
    Posterior: beta | data ~ N(mu_n, Lambda_n^-1)
    """
    # Prior precision matrix
    Lambda_0 = prior_precision * np.eye(n_features)

    # Estimate noise variance from OLS
    ols_model = LinearRegression().fit(X, y)
    sigma_sq = np.mean((y - ols_model.predict(X)) ** 2)

    # Posterior precision: Lambda_n = Lambda_0 + (1/sigma^2) * X^T * X
    Lambda_n = Lambda_0 + (1.0 / sigma_sq) * X.T @ X

    # Posterior mean: mu_n = Lambda_n^-1 * (1/sigma^2) * X^T * y
    mu_n = np.linalg.solve(Lambda_n, (1.0 / sigma_sq) * X.T @ y)

    return {'mu': mu_n, 'Lambda': Lambda_n, 'sigma_sq': sigma_sq}

def predict_with_uncertainty(x, node):
    """Predict with uncertainty quantification."""
    # ... traverse to leaf ...

    model = node.model
    mu = model['mu']
    Lambda = model['Lambda']
    sigma_sq = model['sigma_sq']

    # Predictive mean: x^T * mu_n
    pred_mean = x_scaled @ mu

    # Predictive variance: sigma^2 + x^T * Lambda_n^-1 * x
    Lambda_inv = np.linalg.inv(Lambda)
    pred_var = sigma_sq + x_scaled @ Lambda_inv @ x_scaled.T
    pred_std = np.sqrt(pred_var[0, 0])

    return pred_mean[0], pred_std
Trade-off: Much slower than point estimates (requires matrix inversion, O(p³)), but provides:
- Uncertainty quantification (critical for risk-sensitive applications)
- Natural regularization through priors
- Full posterior distributions
Use when uncertainty matters (finance, medicine, engineering). Avoid when speed is critical and point estimates suffice.
Note: Computing Lambda^-1 is expensive for many features. Use Cholesky decomposition for efficiency:
# More efficient: use Cholesky decomposition
L = np.linalg.cholesky(Lambda)
# Solve L @ L.T @ v = x_scaled.T for v, then pred_var = sigma_sq + x_scaled @ v
Heteroscedastic Error Modeling
Instead of assuming constant error variance, we can model varying variance across regions:
def fit_heteroscedastic_leaf_model(X, y):
    """Fit linear model and estimate local variance function."""
    # First fit standard linear model
    model = Ridge().fit(X, y)
    y_pred = model.predict(X)
    residuals = y - y_pred

    # Option A: Constant variance (homoscedastic)
    sigma_sq_constant = np.var(residuals)

    # Option B: Variance as function of prediction magnitude
    # sigma^2 = a + b * |y_pred| (captures heteroscedasticity)
    abs_pred = np.abs(y_pred)
    if np.std(abs_pred) > 1e-10:
        squared_residuals = residuals ** 2
        variance_model = LinearRegression()
        variance_model.fit(abs_pred.reshape(-1, 1), squared_residuals)
        variance_model.coef_ = np.maximum(variance_model.coef_, 0)  # Ensure non-negative
    else:
        variance_model = None

    return {
        'regression': model,
        'sigma_sq_constant': sigma_sq_constant,
        'variance_model': variance_model
    }

def predict_heteroscedastic(x, node):
    """Predict with heteroscedastic uncertainty."""
    # ... traverse to leaf ...

    model = node.model['regression']
    pred_mean = model.predict(x_scaled)[0]

    # Predict variance
    if node.model['variance_model'] is not None:
        # Heteroscedastic: variance depends on prediction
        abs_pred = np.abs(pred_mean)
        pred_var = node.model['variance_model'].predict([[abs_pred]])[0]
        pred_var = max(pred_var, 0)
    else:
        # Homoscedastic: constant variance
        pred_var = node.model['sigma_sq_constant']

    pred_std = np.sqrt(pred_var)
    return pred_mean, pred_std
Trade-off: More complex, requires more data, but captures:
- Regions with different noise levels (critical for risk modeling)
- Better confidence intervals
- More realistic uncertainty estimates
Use when error variance clearly varies (finance, sensor data). Avoid when homoscedastic assumption is reasonable (simpler is better).
Performance Comparison and Trade-offs
Regularization Methods
| Method | Speed | Stability | Feature Selection | Use When |
|---|---|---|---|---|
| OLS | Fastest | Low (multicollinearity issues) | No | n_samples >> n_features, well-conditioned |
| Ridge | Fast | High | No (all features retained) | General-purpose, multicollinearity present |
| Lasso | Medium | Medium (unstable with correlations) | Yes (sparse) | Many irrelevant features, need interpretability |
| Elastic Net | Medium | High | Yes (selective) | Mix of relevant/irrelevant, correlated features |
Splitting Criteria
| Method | Complexity | Accuracy | Use When |
|---|---|---|---|
| RSS Reduction | O(n × p²) | Highest | Accuracy critical, small-medium datasets |
| Variance Reduction | O(n) | Lower | Speed critical, weak linear relationships |
| Adaptive | O(n) to O(n × p²) | Balanced | Large datasets (use variance for speed, RSS for accuracy) |
Practical Recommendations
- Start with Ridge regression as the default—it’s the safest general-purpose choice.
- Always scale features when using regularization (Ridge/Lasso/Elastic Net).
- Use RSS reduction for splitting when accuracy is critical and datasets are small-medium.
- Use variance reduction or adaptive approach for large datasets where speed matters.
- Set min_samples_leaf ≥ 10-20 per feature to ensure stable regression.
- Use cross-validation to tune regularization strength (alpha).
- Consider pruning if overfitting is observed (requires validation set).
- Use Bayesian regression when uncertainty quantification is needed (finance, medicine).
- Use heteroscedastic modeling when error variance clearly varies across regions.
Example Usage
Here’s a practical example comparing different approaches:
from sklearn.model_selection import train_test_split
from sklearn.metrics import mean_squared_error, r2_score

# Prepare data
X_train, X_test, y_train, y_test = train_test_split(X, y, test_size=0.2)

# Ridge regression (recommended default)
tree_ridge = LinearRegressionTree(
    max_depth=5,
    min_samples_leaf=10,
    regularization='ridge',
    alpha=1.0,
    scale_features=True  # Critical for ridge
)
tree_ridge.fit(X_train, y_train)
y_pred = tree_ridge.predict(X_test)

print(f"MSE: {mean_squared_error(y_test, y_pred):.4f}")
print(f"R²: {r2_score(y_test, y_pred):.4f}")

# Bayesian (with uncertainty)
tree_bayesian = BayesianLinearRegressionTree(
    max_depth=5,
    min_samples_leaf=10,
    prior_precision=1.0,
    scale_features=True
)
tree_bayesian.fit(X_train, y_train)
y_pred, y_std = tree_bayesian.predict(X_test, return_std=True)

# Now we have both predictions and uncertainty estimates
Summary
A linear regression tree with multiple features merges rule-based partitioning with local multivariate regression. By carefully choosing regularization methods, splitting criteria, and advanced techniques like Bayesian inference and heteroscedastic modeling, we can achieve high predictive accuracy while retaining interpretability.
Key Takeaways
- Regularization Choice: Ridge is the safest default; Lasso for feature selection; Elastic Net for balanced approach
- Splitting Criterion: RSS reduction is most accurate but slow; variance reduction is fast but less accurate
- Scaling: Always scale features when using regularization
- Pruning: Use cost-complexity pruning with cross-validation for optimal model selection
- Uncertainty: Bayesian and heteroscedastic models provide uncertainty at the cost of computation
- Minimum Samples: Balance between overfitting (too small) and underfitting (too large)
The choice of technique depends on your specific requirements: speed vs accuracy, interpretability vs performance, point estimates vs uncertainty quantification. Understanding these trade-offs is essential for building effective linear regression trees in practice.